


OSHA FY2025 Inspection Data: What It Means for Construction & Manufacturing Safety Leaders
OSHA’s FY2025 data reveals nearly 80,000 inspections and over 116,000 violations, with construction and manufacturing leading the way. Discover what’s driving enforcement, where risks are highest, and how safety leaders can proactively protect their workforce and stay compliant.

OSHA FY2025 Inspection Data: What It Means for Construction & Manufacturing Safety Leaders
Understanding where OSHA is focusing its enforcement efforts isn’t just helpful—it’s strategic.
The FY2025 OSHA dataset provides a clear picture of where inspections are happening, what’s driving them, and which industries are under the most scrutiny. For safety professionals, this data is more than numbers—it’s a roadmap for reducing risk, improving compliance, and protecting workers.
The Big Picture: OSHA Enforcement at Scale
- 79,691 inspection records
- 116,558 violations issued
This volume highlights one key reality: OSHA enforcement remains highly active and targeted.
For safety directors and plant managers, this reinforces the importance of proactive safety programs rather than reactive compliance.
Industry Breakdown: Where OSHA Is Focusing
Construction Leads the Way
- 33,822 inspections (42.4%)
Manufacturing Still Under Heavy Scrutiny
- 15,713 inspections (19.7%)
Together, these industries account for:
62.2% of all OSHA inspections
What this means:
- High-risk environments continue to receive the most attention
- OSHA is prioritizing industries with elevated exposure to hazards
- Safety programs in these sectors must be continuously evolving

What’s Driving OSHA Inspections?
OSHA enforcement is not random—it’s highly structured.
Top Inspection Triggers:
- Planned Inspections: 30,987
- Complaints: 19,605
- Referrals: 12,464
79.1% of all inspections come from these three sources
Key Takeaways:
- Planned inspections = OSHA targeting known high-risk industries
- Complaints = employee-driven safety concerns
- Referrals = third-party or agency escalations
This reinforces the importance of:
- Strong internal reporting systems
- Open communication with employees
- Addressing hazards before they escalate externally
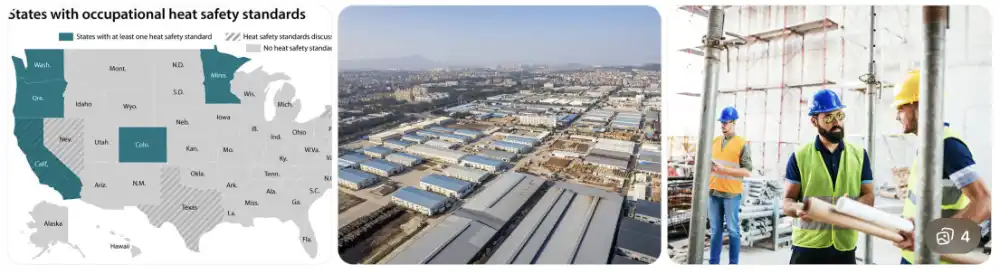
Geographic Hotspots: Where Enforcement Is Highest
Top states for OSHA inspections:
- California – 7,492
- Washington – 5,584
- Oregon – 3,996
- Texas – 3,894
- Michigan – 3,832
What This Means for National Companies
- OSHA emphasis programs vary regionally
- Multi-location companies must standardize safety protocols across states
- High-enforcement regions often influence broader national trends
High-Risk Construction Segments
Within construction, OSHA inspections are highly concentrated:
- Roofing Contractors: 7,707 inspections
- Framing Contractors: 4,240 inspections
- Commercial Building Construction: 4,009 inspections
Why Roofing Leads
Roofing consistently ranks high due to:
- Fall hazards
- Elevated work environments
- Weather exposure
- PPE compliance challenges
This is a strong signal to prioritize:
- Fall protection systems
- Jobsite audits
- Equipment compliance checks

Seasonal Trends: When Inspections Spike
Peak months
- October 2024: 7,773 inspections
- March 2025: 7,727 inspections
- April 2025: 7,346 inspections
Strategic Insight
Fall and early spring show increased enforcement likely tied to:
-
- Construction season peaks
- Weather-related hazards
- OSHA emphasis programs
Smart Move Schedule internal audits before these peak periods.
How Advanced Safety & Industrial Supply Can Help
At Advanced Safety & Industrial Supply, we help companies stay ahead of OSHA—not behind it.
Our Solutions Include:
- OSHA compliance training
- Jobsite and facility safety audits
- PPE sourcing and standardization
- Industrial hygiene testing
- Equipment calibration and inspection
- Custom safety programs

Don’t wait for an OSHA inspection to find gaps in your safety program.
Contact Advanced Safety & Industrial Supply today to:
- Schedule a safety audit
- Review your compliance program
- Equip your team with the right PPE


